Latest
America’s New Steel and Aluminum Protectionism

Ross urged President Trump to take immediate action by adjusting the level of imports through quotas or tariffs. Trump is likely to invoke Section 232 of the 1962 Trade Act, which allows the president to impose tariffs without congressional approval. He must respond to the reports by April 11 and 19 for steel and aluminum, respectively.
China, the main target of the proposals (though a minor steel importer into the U.S.), contends that the U.S. already has excessive protections on domestic iron and steel products and it reserves the right to retaliate.
The proposed policy instruments suggest that the Trump administration is willing to subsidize American steel and aluminum, even at the expense of far bigger and more consequential U.S. industries – and the world trade.
From Trade Expansion to Trade Contraction
While the proposed measures vary from broad adjustments that involve many countries to targeted adjustments that focus on a few countries, the rationale of the suggested figures is fuzzy and ultimately undermined by geopolitical considerations.
Regarding steel, the Commerce Department recommends that the U.S. could introduce a global tariff of at least 24 percent on steel imports from all countries. Another option would be a tariff of 53 percent on all steel imports from 12 countries (none are advanced economies, except for South Korea), with a quota on steel imports from all other countries equal to 100 percent of their 2017 exports to the U.S. In the third option, a quota could be enacted on steel products from equal to 63 percent of each country’s 2017 exports to the United States.
In aluminum, the Commerce Department recommends a 7.7 percent tariff on imports from all exporter countries. The second option is a 23.5 percent tariff on aluminum products from China, Hong Kong, Russia, Venezuela and Vietnam, with a cap for all countries at 2017 import levels. A third option would be an aluminum import quota on all countries, at 86.7 percent of their 2017 imports.
Nevertheless, President Trump is given substantial geopolitical leeway. He could have specific countries exempted from the proposed quota, based on U.S. economic interests or national security. Moreover, he could also take into account each country’s willingness to cooperate with the U.S. to address global excess capacity (read: turn against China) and other challenges that face the U.S. aluminum and steel industries.
This leeway permits Trump to seize unilateral geopolitical objectives to undermine any semblance of multilateral economic cooperation and to deploy the imperial “divide and rule” principle to play targeted countries against each other.
Ironically, President Kennedy used the Trade Expansion Act of 1962 to negotiate tariff reductions of up to 80 percent, which paved the way for the Kennedy Round of General Agreement on Tariffs and Trade ("GATT") negotiations that ended in 1967 and eventually led to the World Trade Organization (WTO) in 1995. In contrast, President Trump is exploiting the seldom-used Section 232 of the Act to increase trade barriers, in order to undermine or reverse 50 years of trade progress in just a few years.
In effect, Trump is trying to use the Trade Expansion Act for trade contraction.
Broadening the Scope of New Protectionism
In his campaign, Trump targeted those economies with which America has the largest aggregate trade deficit. In order to legitimize a trade offense, which has a highly questionable legal basis, he is starting by focusing on steel, but is expanding to aluminum. The ultimate objective is to target America’s deficit partners, however. The proposed measures are just a means to that final goal.
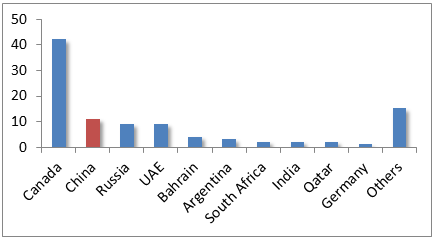
In 2017, U.S. imports increased 34 percent to $22 billion. The U.S. is the world’s largest steel importer. The top 10 source countries for steel imports represent 78 percent of the total steel import volume. Canada accounts for the largest share (16 percent) followed by Brazil, South Korea, Mexico and Russia (Figure a). Although China has a key role in the proposed tariffs and quotas, it is not even among the top-steel importers into the U.S. If the White House targeted its tariffs and quotas proportionately, it should hit its North American Free Trade (NAFTA) allies and trade partners in Asia hardest, which together account for half of all steel imports.

In 2017, U.S. aluminum imports increased some 31 percent to $13.9 billion, while U.S. production of primary aluminum decreased for the fourth consecutive year to the lowest level since 1951. Like in steel, Canada is the leading source of aluminum imports into the U.S., accounting for more than two-fifths of total imports by both value and weight in 2016. Imports from China amounted to only half of that, a slight decline from their 2015 levels. This contrasts with the Commerce Department’s claim that imports from China were significantly up.

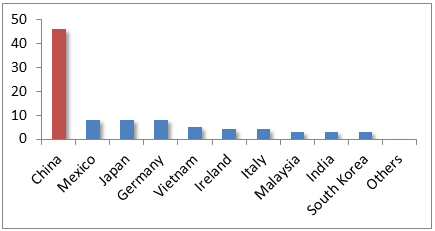
What are the economic realities of the U.S. trade deficits? In 2017, America incurred an $863 billion trade deficit (up 8.1 percent from 2016). The highest deficit was with China ($396 billion), followed by Mexico ($74 billion) and Japan ($72 billion). These are the countries that Trump is really after (Figure c). In order to achieve that objective, the White House seems to be willing to risk its economic and strategic cooperation with China, undermine ties with its NAFTA partners, alienate its European North American Treaty Organization (NATO) allies and undercut alliances with the rest of its trade and security partners in Asia.

The record to date is distressing. Recently, the Trump administration announced tariffs on imported solar cells and modules, which protect a small number of U.S.-based solar manufacturers (including one Chinese-owned firm), while destroying some 23,000 American solar workers’ jobs. China has already retaliated. Moreover, South Korea is considering filing a complaint with the World Trade Organization if the U.S. levies heavy duties on steel.
In turn, Trump is likely to resort to Section 301 of the Trade Act of 1974 to unilaterally seek remedies for unfair Chinese trade practices, which will risk Chinese retaliation and a tit-for-tat trade war, just as the Tariff Act of 1930 did, with dark consequences. Such moves risk undermining not just international trade but the very institutions— trade-dispute resolution mechanisms— that support it.
Time to Apply the Right Lessons
Amid the world trade collapse in 2008, Jagdish Bhagwati published his Termites in the Trading System, which demonstrated how preferential agreements undermine free trade. Since the end of the Cold War, both Republican and Democratic leaders have moved toward such pacts. Until 2016, those moves were gradual and occurred one pact at a time. However, in the Trump era, the shift is disruptive and multilateral. Today, the international trading system is not threatened by little termites nibbling away walls, but a huge stealth termite— new protectionism— munching away the very foundations of world trade.
Steel and aluminum overcapacity crises are multilateral and have global repercussions, not bilateral as the U.S. measures imply. China’s rise has not come at the expense of the U.S. After the Cold War, the U.S. economy accounted for a fourth of global GDP. Today, the corresponding figure is about the same. Moreover, research indicates that U.S. job losses are the net effect of technology and automation, not just of offshoring to China, India and emerging economies.
Second, since China continues to support world trade and investment, its role is vital to global growth prospects. And as industrialization will intensify in India and other emerging economies, so will their need for steel, aluminum and other commodities. Rapid economic development that supports global growth prospects should not be penalized.
Third, through the Silk Road initiatives (OBOR), Chinese overcapacity can serve industrialization in emerging economies that participate in these initiatives, which also offer opportunities to advanced economies.
Finally, any sustained success in overcoming the global steel and aluminum friction must be based on multilateral cooperation with all major producers, that will seek to reduce overcapacity in the largest producers but will also ensure emerging economies’ opportunities for rapid economic development in the future.
Dr Steinbock is the founder of the Difference Group and has served as the research director at the India, China, and America Institute (USA) and a visiting fellow at the Shanghai Institutes for International Studies (China) and the EU Center (Singapore).

Advertisement
-
TEVTA announces new teaching jobs; Here's how to apply online
09:46 PM | 16 Apr, 2024 -
Eid al-Adha 2024: Date announced for the Muslim festival
09:20 PM | 16 Apr, 2024 -
Punjab Motorcycle Scheme: How to Register? A Step-by-Step Guide
08:59 PM | 16 Apr, 2024 -
New office timings for govt employees notified
08:31 PM | 16 Apr, 2024 -
Death penalty in Pakistan: These survey results will surprise you!
08:12 PM | 16 Apr, 2024
PKR rate against US Dollar, Euro, Pound, Riyal - Check 16 April forex rates
Pakistani currency gains momentum against all currencies on April 16, 2024 Tuesday. US dollar was being quoted at 277.9 for buying and 280.85 for selling.
Euro was quoted at 295 for buying and 298 for selling while British Pound stands at 345 for buying, and 349 for selling.
UAE Dirham AED was at 75.4 and Saudi Riyal's new rates was at 73.30.
Today’s currency exchange rates in Pakistan - 15 April 2024
| Currency | Symbol | Buying | Selling |
|---|---|---|---|
| US Dollar | USD | 277.9 | 280.85 |
| Euro | EUR | 295 | 298 |
| UK Pound Sterling | GBP | 345 | 349 |
| U.A.E Dirham | AED | 75.45 | 76.2 |
| Saudi Riyal | SAR | 73.3 | 74.05 |
| Australian Dollar | AUD | 182.7 | 184.5 |
| Bahrain Dinar | BHD | 739.38 | 747.38 |
| Canadian Dollar | CAD | 204 | 206.2 |
| China Yuan | CNY | 38.45 | 38.85 |
| Danish Krone | DKK | 40.45 | 40.85 |
| Hong Kong Dollar | HKD | 35.57 | 35.92 |
| Indian Rupee | INR | 3.33 | 3.44 |
| Japanese Yen | JPY | 1.86 | 1.94 |
| Kuwaiti Dinar | KWD | 903.91 | 912.91 |
| Malaysian Ringgit | MYR | 58.92 | 59.52 |
| New Zealand Dollar | NZD | 167.63 | 169.63 |
| Norwegians Krone | NOK | 25.38 | 25.68 |
| Omani Riyal | OMR | 722.1 | 730.1 |
| Qatari Riyal | QAR | 76.35 | 77.05 |
| Singapore Dollar | SGD | 206 | 208 |
| Swedish Korona | SEK | 25.72 | 26.02 |
| Swiss Franc | CHF | 307.11 | 309.61 |
| Thai Bhat | THB | 7.61 | 7.76 |
Advertisement
Lifestyle
Blogs
- Who is the most followed Pakistani actor on Instagram? 09:55 PM | 3 Apr, 2024
- Forbes 2024 List of World's Billionaires is out now: Taylor Swift, ChatGPT founder enter elite ranks 12:12 PM | 3 Apr, 2024
- Pakistan's ranking improves by 7 spots in Transparency International Corruption index 01:52 PM | 30 Jan, 2024
- Pakistan Army ranked among top 10 strongest militaries in the world 01:42 PM | 17 Jan, 2024
- 10 Top Google searches made by Pakistanis in 2024 09:36 PM | 20 Mar, 2024
- Famous People Who Passed Away in 2023 08:35 PM | 26 Dec, 2023
Follow us on Facebook
Follow us on Twitter
Sign up for Newsletter
Copyright ©2024. Reproduction of this website's content without express written permission from 'Daily Pakistan' is strictly prohibited.
