Average Pakistani adult is 20% richer than an average Indian adult and the median wealth of a Pakistani adult is 120% higher than that of his or her Indian counterpart, according to Credit Suisse Wealth Report 2016. Average household wealth in Pakistan has grown 2.1% while it has declined 0.8% in India since the end of last year.
 Credit Suisse
Total Household Wealth Mid-2016:
India $3,099 billion – Pakistan $524 billion
Wealth per adult:
India Year End 2000 Average $2,036 Median $498.00
Pakistan Year End 2000 Average $2,399 Median $1,025
India Mid-2016 Average $3,835 Median $608
Pakistan Mid-2016 Average $4,595 Median $1,788
Average wealth per adult in Pakistan is $760 more than in India or about 20% higher.
Median wealth per adult in Pakistan is $1,180 more than in India or about 120% higher
Inequality:
Median wealth data indicates that 50% of Pakistanis own more than $1,180 per adult which is 120% more than the $608 per adult owned by 50% of Indians.
The Credit-Suisse report says that the richest 1% of Indians own 58.4% of India’s wealth, second only to Russia’s at 74.5%. That makes India the 2nd biggest oligarchy in the world.
The CS wealth data, particularly the median wealth figures, clearly show that Pakistan has much lower levels of inequality than India.
World Bank Report:
A November 2016 World Bank report says that Pakistan has successfully translated economic growth into the well-being of its poorest citizens. It says “Pakistan’s recent growth has been accompanied by a staggering fall in poverty”.
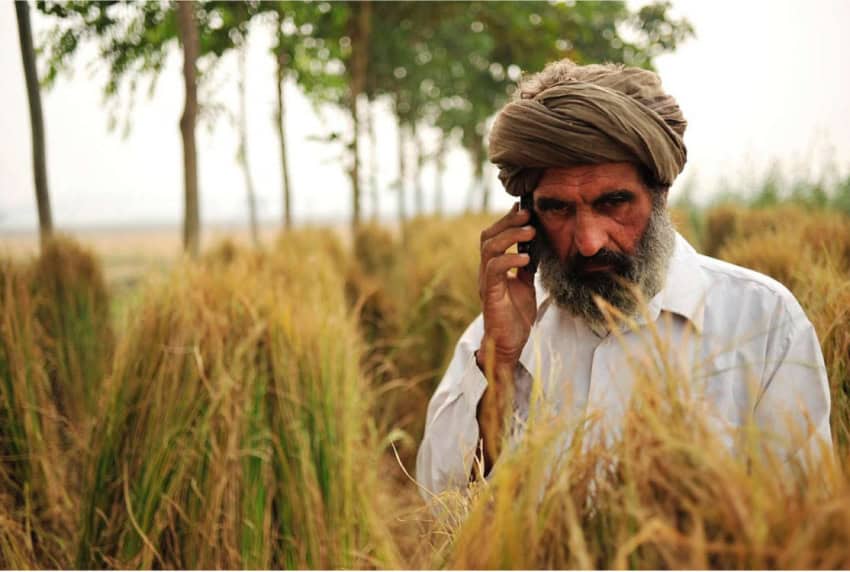
Rising incomes of the poorest 20% in Pakistan since 2002 have enabled them to enhance their living standards by improving their diets and acquiring television sets, refrigerators, motorcycles, flush toilets, and better housing.
Another recent report titled “From Wealth to Well Being” by Boston Consulting Group (BCG) also found that Pakistan does better than India and China in translating GDP growth to citizens’ well-being.
One particular metric BCG report uses is growth-to-well-being coefficient on which Pakistan scores 0.87, higher than India’s 0.77 and China’s 0.75.
Big Poverty Decline Since 2002:
Using the old national poverty line of $1.90 (ICP 2011 PPP) , set in 2001, the percentage of people living in poverty fell from 34.7 percent in FY02 to 9.3 percent in FY14—a fall of more than 75 percent. Much of the socioeconomic progress reported by the World Bank since 2000 has occurred during President Musharraf’s years in office from 2000-2007. It has dramatically slowed or stagnated since 2010.
 Source: World Bank
Using the new 2016 poverty line of $3.50 (ICP 2011 PPP), 29.5 percent of Pakistanis as poor (using the latest available data from FY14). By back casting this line, the poverty rate in FY02 would have been about 64.3 percent.
Pakistan’s new poverty line sets a minimum consumption threshold of Rs. 3,030 or $105 (ICP 2011 PPP) per person per month or $3.50 (ICP 2011 PPP) per person per day. This translates to between Rs. 18,000 and Rs. 21,000 per month for a household at the poverty line, allowing nearly 30% of the population or close to 60 million people to be targeted for pro-poor and inclusive development policies—thus setting a much higher bar for inclusive development.
Multi-dimensional Poverty Decline:
A UNDP report released in June 2016 said Pakistan’s MPI (Multi-dimensional poverty index) showed a strong decline, with national poverty rates falling from 55% to 39% from 2004 to 2015. MPI goes beyond just income poverty.
The Multidimensional Poverty Index uses a broader concept of poverty than income and wealth alone. It reflects the deprivations people experience with respect to health, education and standard of living, and is thus a more detailed way of understanding and alleviating poverty. Since its development by OPHI and UNDP in 2010, many countries, including Pakistan, have adopted this methodology as an official poverty estimate, complementing consumption or income-based poverty figures.
Rising Living Standards of the Poorest 20% in Pakistan:
According to the latest World Report titled “Pakistan Development Update: Making Growth Matter” released this month, Pakistan saw substantial gains in welfare, including the ownership of assets, the quality of housing and an increase in school enrollment, particularly for girls.
 Source: World Bank
First, the ownership of relatively more expensive assets increased even among the poorest. In the bottom quintile, the ownership of motorcycles increased from 2 to 18 percent, televisions from 20 to 36 percent and refrigerators from 5 to 14 percent.
In contrast, there was a decline in the ownership of cheaper assets like bicycles and radios.
 Source: World Bank
Housing quality in the bottom quintile also showed an improvement. The number of homes constructed with bricks or blocks increased while mud (katcha) homes decreased. Homes with a flushing toilet almost doubled in the bottom quintile, from about 24 percent in FY02 to 49 percent in FY14.
Dietary Improvements for the Poorest 20% in Pakistan:
Decline in poverty led to an increase in dietary diversity for all income groups.
For the poorest, the share of expenditure devoted to milk and milk products, chicken, eggs and fish rose, as did the share devoted to vegetables and fruits.
In contrast, the share of cereals and pulses, which provide the cheapest calories, declined steadily between FY02 and FY14. Because foods like chicken, eggs, vegetables, fruits, and milk and milk products are more expensive than cereals and pulses, and have lower caloric content, this shift in consumption also increased the amount that people spent per calorie over time.
For the poorest quintile, expenditure per calorie increased by over 18 percent between FY02 and FY14. Overall, this analysis confirms that the decline in poverty exhibited by the 2001 poverty line is quite credible, and that Pakistan has done remarkably well overall in reducing monetary poverty based on the metric it set some 15 years ago, says the World Bank.
Summary:
In spite of Pakistan’s many challenges on multiple fronts, the country has successfully translated its GDP growth into the well-being of its poorest citizens. “Pakistan’s recent growth has been accompanied by a staggering fall in poverty”, says a November 2016 World Bank report. An earlier report by Boston Consulting Group reached a similar conclusion.


